

An important class of point operations is based upon the manipulation of an image histogram or a region histogram. The most important examples are described below.

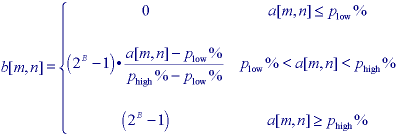
This formula, however, can be somewhat sensitive to outliers and a less sensitive and more general version is given by:

In this second version one might choose the 1% and 99% values for plow% and phigh%, respectively, instead of the 0% and 100% values represented by eq. . It is also possible to apply the contrast-stretching operation on a regional basis using the histogram from a region to determine the appropriate limits for the algorithm. Note that in eqs. and it is possible to suppress the term 2B-1 and simply normalize the brightness range to 0 <= b[m,n] <= 1. This means representing the final pixel brightnesses as reals instead of integers but modern computer speeds and RAM capacities make this quite feasible.
 (a) into
a histogram that is constant for all brightness values. This would correspond
to a brightness distribution where all values are equally probable.
Unfortunately, for an arbitrary image, one can only approximate this result.
For a "suitable" function  (*) the relation between the input
probability density function, the output probability density function, and the
function
  (*) is given by:

From eq. we see that "suitable" means that  (*) is differentiable
and that d
 /da >= 0. For histogram equalization we
desire that pb(b) = constant and this means that:

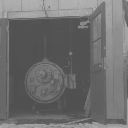
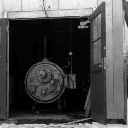
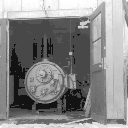
where P(a) is the probability distribution function defined in Section 3.5.1 and illustrated in Figure 6a. In other words, the quantized probability distribution function normalized from 0 to 2B-1 is the look-up table required for histogram equalization. Figures 21a-c illustrate the effect of contrast stretching and histogram equalization on a standard image. The histogram equalization procedure can also be applied on a regional basis.


