


The process of image acquisition frequently leads (inadvertently) to image degradation. Due to mechanical problems, out-of-focus blur, motion, inappropriate illumination, and noise the quality of the digitized image can be inferior to the original. The goal of enhancement is-- starting from a recorded image c[m,n]--to produce the most visually pleasing image â[m,n]. The goal of restoration is--starting from a recorded image c[m,n]--to produce the best possible estimate â[m,n] of the original image a[m,n]. The goal of enhancement is beauty; the goal of restoration is truth.
The measure of success in restoration is usually an error measure between the original a[m,n] and the estimate â[m,n]: E{â[m,n], a[m,n]}. No mathematical error function is known that corresponds to human perceptual assessment of error. The mean-square error function is commonly used because:
1. It is easy to compute;
2. It is differentiable implying that a minimum can be sought;
3. It corresponds to "signal energy" in the total error, and;
4. It has nice properties vis à vis Parseval's theorem, eqs. (22) and (23).
The mean-square error is defined by:

In some techniques an error measure will not be necessary; in others it will be essential for evaluation and comparative purposes.

The term k is the amplifying term and k > 0. The effect of this technique is shown in Figure 48.
The Laplacian used to produce Figure 48 is given by eq. (120) and the amplification term k = 1.
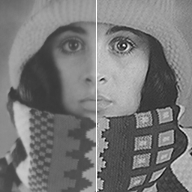

 Laplacian-enhanced

will produce a result where the mean value of each pixel will be unchanged. For
each pixel, however, the standard deviation will decrease from  to
to
 .
.
If temporal averaging is not possible, then spatial averaging can be used to decrease the noise. This generally occurs, however, at a cost to image sharpness. Four obvious choices for spatial averaging are the smoothing algorithms that have been described in Section 9.4 - Gaussian filtering (eq. (93)), median filtering, Kuwahara filtering, and morphological smoothing (eq. ).
Within the class of linear filters, the optimal filter for restoration in the presence of noise is given by the Wiener filter . The word "optimal" is used here in the sense of minimum mean-square error (mse). Because the square root operation is monotonic increasing, the optimal filter also minimizes the root mean-square error (rms). The Wiener filter is characterized in the Fourier domain and for additive noise that is independent of the signal it is given by:

where Saa(u,v) is the power spectral density of an ensemble of random images {a[m,n]} and Snn(u,v) is the power spectral density of the random noise. If we have a single image then Saa(u,v) = |A(u,v)|2. In practice it is unlikely that the power spectral density of the uncontaminated image will be available. Because many images have a similar power spectral density that can be modeled by Table 4-T.8, that model can be used as an estimate of Saa(u,v).
A comparison of the five different techniques described above is shown in
Figure 49. The Wiener filter was constructed directly from eq. because the
image spectrum and the noise spectrum were known. The parameters for the other
filters were determined choosing that value (either  or window
size) that led to the minimum rms.


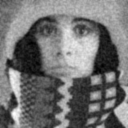
a) Noisy image (SNR=20 dB) b) Wiener filter
c) Gauss filter ( = 1.0)
rms = 25.7 rms = 20.2 rms = 21.1
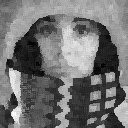
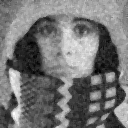
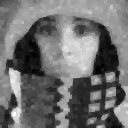
d) Kuwahara filter (5 x 5) e) Median filter (3 x 3) f) Morph. smoothing (3 x 3)
rms = 22.4 rms = 22.6 rms = 26.2
The root mean-square errors (rms) associated with the various filters are shown in Figure 49. For this specific comparison, the Wiener filter generates a lower error than any of the other procedures that are examined here. The two linear procedures, Wiener filtering and Gaussian filtering, performed slightly better than the three non-linear alternatives.
 [m,n]. Various aspects of
ho[m,n] and
  [m,n]
have been discussed in earlier sections. The most common combination of these
is the additive model:

The restoration procedure that is based on linear filtering coupled to a minimum mean-square error criterion again produces a Wiener filter :
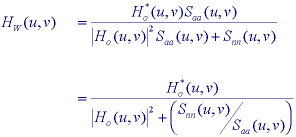
Once again Saa(u,v) is the power spectral density of an image, Snn(u,v) is the power spectral density of the noise, and o(u,v) = F{ho[m,n]}. Examination of this formula for some extreme cases can be useful. For those frequencies where Saa(u,v) >> Snn(u,v), where the signal spectrum dominates the noise spectrum, the Wiener filter is given by 1/o(u,v), the inverse filter solution. For those frequencies where Saa(u,v) << Snn(u,v), where the noise spectrum dominates the signal spectrum, the Wiener filter is proportional to o*(u,v), the matched filter solution. For those frequencies where o(u,v) = 0, the Wiener filter W(u,v) = 0 preventing overflow.
The Wiener filter is a solution to the restoration problem based upon the hypothesized use of a linear filter and the minimum mean-square (or rms) error criterion. In the example below the image a[m,n] was distorted by a bandpass filter and then white noise was added to achieve an SNR = 30 dB. The results are shown in Figure 50.
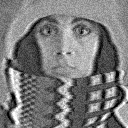


rms = 108.4 rms = 40.9 Figure 50: Noise and distortion suppression using the Wiener filter, eq. and the median filter.
The rms after Wiener filtering but before contrast stretching was 108.4; after contrast stretching with eq. (77) the final result as shown in Figure 50b has a mean-square error of 27.8. Using a 3 x 3 median filter as shown in Figure 50c leads to a rms error of 40.9 before contrast stretching and 35.1 after contrast stretching. Although the Wiener filter gives the minimum rms error over the set of all linear filters, the non-linear median filter gives a lower rms error. The operation contrast stretching is itself a non-linear operation. The "visual quality" of the median filtering result is comparable to the Wiener filtering result. This is due in part to periodic artifacts introduced by the linear filter which are visible in Figure 50b.
