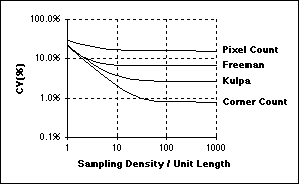


The "rules" for choosing the sampling density when the goal is image analysis--as opposed to image processing--are different. The fundamental difference is that the digitization of objects in an image into a collection of pixels introduces a form of spatial quantization noise that is not bandlimited. This leads to the following results for the choice of sampling density when one is interested in the measurement of area and (perimeter) length.

and in D dimensions:

where S is the number of samples per object diameter. In 2D the measurement is area, in 3D volume, and in D-dimensions hypervolume.

Figure 17: CV of length measurement for various algorithms.
The curves in Figure 17 were developed in the context of straight lines but similar results have been found for curves and closed contours. The specific formulas for length estimation use a chain code representation of a line and are based upon a linear combination of three numbers:

where Ne is the number of even chain codes, No the number of odd chain codes, and Nc the number of corners. The specific formulas are given in Table 7.
Coefficients
|
a
|

|

|
|
| Formula
|
Reference
| |||
| Pixel
count
|
1
|
1
|
0
|
[18]
|
| Freeman
|
1
|

|
0
|
[11]
|
| Kulpa
|
0.9481
|
0.9481
*

|
0
|
[20]
|
| Corner
count
|
0.980
|
1.406
|
-0.091
|
[21]
|
