Figure 13: Standard observer color sensitivity curves.


uman color perception is an exceedingly complex topic. As such we can only present a brief introduction here. The physical perception of color is based upon three color pigments in the retina.
 .
These are shown in Figure 13. These are not the actual pigment
absorption characteristics found in the "standard" human retina but rather
sensitivity curves derived from actual data .

Figure 13: Standard observer color sensitivity curves.
For an arbitrary homogeneous region in an image that has an intensity as a
function of wavelength (color) given by I( ), the three
responses are called the tristimulus values:


The red chromaticity coordinate is given by x and the green chromaticity
coordinate by y. The tristimulus values are linear in
I( ) and thus the absolute intensity information has
been lost in the calculation of the chromaticity coordinates
{x,y}. All color distributions, I(
 ), that
appear to an observer as having the same color will have the same chromaticity
coordinates.
If we use a tunable source of pure color (such as a dye laser), then the
intensity can be modeled as I( ) =
d(
 -
-
 o) with d(*) as
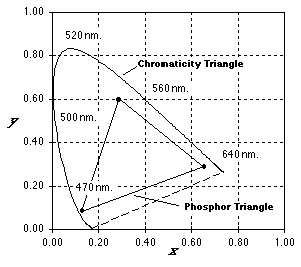
the impulse function. The collection of chromaticity coordinates
{x,y} that will be generated by varying
 o gives the CIE
chromaticity triangle as shown in Figure 14.

Figure 14: Chromaticity diagram containing the CIE chromaticity triangle associated with pure spectral colors and the triangle associated with CRT phosphors.
Pure spectral colors are along the boundary of the chromaticity triangle. All other colors are inside the triangle. The chromaticity coordinates for some standard sources are given in Table 6.
Source
|
x
|
y
|
| Fluorescent
lamp
4800 deg.K
|
0.35
|
0.37
|
| Sun
6000 deg.K
|
0.32
|
0.33
|
| Red
Phosphor (europium yttrium vanadate)
|
0.68
|
0.32
|
| Green
Phosphor (zinc cadmium sulfide)
|
0.28
|
0.60
|
| Blue
Phosphor (zinc sulfide)
|
0.15
|
0.07
|
The description of color on the basis of chromaticity coordinates not only permits an analysis of color but provides a synthesis technique as well. Using a mixture of two color sources, it is possible to generate any of the colors along the line connecting their respective chromaticity coordinates. Since we cannot have a negative number of photons, this means the mixing coefficients must be positive. Using three color sources such as the red, green, and blue phosphors on CRT monitors leads to the set of colors defined by the interior of the "phosphor triangle" shown in Figure 14.
The formulas for converting from the tristimulus values (X,Y,Z) to the well-known CRT colors (R,G,B) and back are given by:

and

As long as the position of a desired color (X,Y,Z) is inside the phosphor triangle in Figure 14, the values of R, G, and B as computed by eq. will be positive and can therefore be used to drive a CRT monitor.
It is incorrect to assume that a small displacement anywhere in the chromaticity diagram (Figure 14) will produce a proportionally small change in the perceived color. An empirically-derived chromaticity space where this property is approximated is the (u',v') space:

Small changes almost anywhere in the (u',v') chromaticity space produce equally small changes in the perceived colors.
