 ).
Further let us assume that I(
 ) = Io,
a constant.


There are several ways to describe the sensitivity of the human visual system.
To begin, let us assume that a homogeneous region in an image has an intensity
as a function of wavelength (color) given by I( ).
Further let us assume that I(
 ) = Io,
a constant.
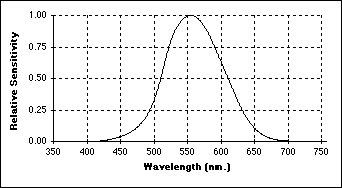
 , the spectral
sensitivity, for the "typical observer" is shown in Figure 10 .

Figure 10: Spectral Sensitivity of the "typical" human observer

The implications of this are easy to illustrate. Equal perceived steps
in brightness,  R = k, require that the physical
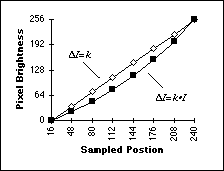
brightness (the stimulus) increases exponentially. This is illustrated in
Figure 11ab.
A horizontal line through the top portion of Figure 11a shows a linear increase in objective brightness (Figure 11b) but a logarithmic increase in subjective brightness. A horizontal line through the bottom portion of Figure 11a shows an exponential increase in objective brightness (Figure 11b) but a linear increase in subjective brightness.

 Figure 11a Figure 11b (top) Brightness step
  I =
k Actual brightnesses plus interpolated values (bottom) Brightness step
 I = k*I
The Mach band effect is visible in Figure 11a. Although the physical brightness is constant across each vertical stripe, the human observer perceives an "undershoot" and "overshoot" in brightness at what is physically a step edge. Thus, just before the step, we see a slight decrease in brightness compared to the true physical value. After the step we see a slight overshoot in brightness compared to the true physical value. The total effect is one of increased, local, perceived contrast at a step edge in brightness.
